


The Connected Lab (Full)


The Investments Are Real, The Connections Aren't
Over the past decade, life science organizations have made two large, separate investments in the future of how they do science. One has gone into the enterprise digital stack: cloud platforms, data lakes, electronic lab notebooks (ELNs), laboratory information management systems (LIMS), and increasingly, AI and machine learning capabilities. The other has gone into the lab itself: instruments, liquid handlers, robotics, sample storage, and automated work cells designed to industrialize what was once manual bench work.
On paper, these two investments should produce a connected scientific enterprise, one in which data flows continuously from instruments to insight, and in which AI models close the loop back to experiments. In practice, they rarely do. Executives recognize the symptoms:
- Fragmented data that they cannot unify across sites or after an acquisition
- Turnaround times that are too slow to defend
- Hidden operating costs
- Scientific decisions that stall because the underlying data cannot be trusted
This paper makes a simple argument. The disconnect is not primarily a tooling problem, a vendor problem, or a culture problem. It is an architecture problem. A modern lab is a stack of four layers: instruments, orchestration, data fabric, and analytics. Most organizations have invested in the top and the bottom layers while leaving the connections between them as team responsibilities. No single purchase fixes a disconnected lab. The capital deployed on either end underperforms until that architecture exists.
No single purchase fixes a disconnected lab. Before you lay a single brick, you need an architecture that treats all four layers as one system.
There is a reason this matters more now than it did three years ago. AI and modern informatics are compressing the Design and Analyze halves of the R&D loop from months into weeks. As those halves speed up, the bottleneck moves to Make and Test, the physical lab. An AI strategy is now only as fast as the lab that can feed it, which is what turns a connected lab from a nice-to-have into the rate-limiting step.
We propose a four-layer model that names each layer, locates it correctly in the stack, and clarifies how they connect. We call it the Digital Lab Maturity Model (DLMM). The DLMM is the basis for a maturity matrix, a structured assessment we use inside customer engagements to benchmark where a lab is today and chart where it should go next. The DLMM gives executives a set of decision questions that they can take into their next planning cycle. It is also the lens through which we believe the biggest open question in the industry, the move from AI pilots to AI in production, should be evaluated.
The practical output of this model is the Connected Lab Maturity Benchmark: score the four layers, find the seams that are limiting AI readiness and turnaround, and leave with the highest-leverage moves to make next.
The argument of this paper is focused on the success of an organization's scientific and data goals: that a connected lab is achieved only when instruments, orchestration, data fabric, and analytics are designed together, as a single strategy.
The paper is written jointly by HighRes, the lab automation company behind the Cellario OS orchestration platform, and Involve Data, a data strategy firm focused on digital and AI architecture. We have written it together because the connected lab spans both of our areas of expertise, from robot arms to enterprise data and AI infrastructure, and because the customers who feel this gap most acutely are the ones for whom neither a pure vendor nor a pure consultancy can give a complete answer.
01. The Diagnosis: Symptoms Executives Recognize
Conversations with senior life science leaders about digital transformation tend to circle a recognizable set of complaints. The complaints are not unique to any one company, therapeutic area, or stage of growth. They show up in discovery biotechs and in the digital steering committees of top-twenty pharma. They are remarkably consistent.
The day to day user feels a broken integration or tools that do not talk to each other; the senior leader feels a decision they cannot make, a cost they cannot see, or a timeline they cannot defend. Here, we give language to what you are experiencing. In the next section, we argue that they all trace to a single underlying cause.
"I cannot get a holistic picture from our data."
A common executive frustration is fragmentation impacting decision making. Research happens on islands, by site, by team, by acquired company, and each island has its own conventions, its own systems, and its own idea of what a result looks like. Leadership cannot get a unified picture across them. The frustration sharpens after an acquisition when leadership discovers the acquired company's data cannot be used without substantial integration work, or during a program readout, when the team cannot quickly pull the full picture together in a summary. This is not a complaint about a single tool. It is a complaint that the organization has no common way to make its data cross-comparable, and therefore no way to reason about its science as a whole.
"Our turnaround time is too slow, and I can't prove the investment paid off to get us to discovery faster."
Executives track turnaround time (TAT) and iteration speed because those numbers tie directly to cost, to competitiveness, and to whether a capital investment was justified. When a workflow is automated, the question that comes back is immediate and quantitative: what was the change in TAT, and was the investment worth it for speed to discovery? Leaders are asked to defend these numbers on a regular cadence. When the lab and the digital stack are disconnected, TAT is both slow and tedious to measure, which means the investment case is harder to prove after the fact.
"I don't actually know what this really costs to run."
Any lab can produce a budget: reagents, instrument depreciation, service contracts, headcount. That arithmetic is the easy part. The costs that never reach a line item are the ones that distort the picture, and most of them are time: hours spent hunting for a prior result across shared drives and notebooks, data reformatted and reconciled by hand before the real analysis starts, experiments re-run because the earlier data could not be found or trusted, protocols executed manually because the instruments were never connected to anything. None of this shows up as a discrete expense; it is absorbed into salary lines that read as fully productive. Therefore the true cost of an assay, a workflow, or a lab is consistently understated, and leaders benchmark performance and justify investments against a number that leaves out a large, hidden component, limiting an organization's ability to effectively forecast.
"I can't make the call because I don't have the data I need."
In a research lab, a decision is only as sound as the data behind it, and data is only trustworthy when its full provenance is intact: which assay ran, on which samples, under what conditions. When any of that chain is missing or reconstructed after the fact, the result cannot be defended, and the decision it was meant to support defaults to intuition instead of evidence. The cost is not a flawed report. It is a program continued that should have been killed or vice versa.
"We spent a fortune on the lab, and it is not paying off."
Perhaps the most straightforward frustration is at the level of digital strategy and finance. A lab has invested heavily in automated instruments and, separately, in a modern ELN, LIMS, and cloud platform, yet the path between them still runs through manual export, brittle scripts, and a scientist copying values into a spreadsheet. To a leader who signed off on both investments, this is the visible proof that the pieces were never connected into a system. It also quietly caps throughput, inflates cost, and slows turnaround, the three things the boardroom is measuring. When the time comes to invest in a new instrument, a new platform, or a new piece of digital infrastructure, the decision is made narrowly, by the team that will use the tool, against criteria that the tool itself defines. There is rarely a coherent picture of how the new investment will fit into the existing stack, what assumptions it makes about adjacent layers, or what new dependencies it creates.
Years of tool-by-tool decisions accumulate into an estate that no one designed and no one fully understands.
Each of these frustrations has its own vendors offering relief, better dashboards, better integrations, better LIMS, better AI, better instruments. None is wrong on its own. But none addresses the structural cause, and beneath all of them sits a single problem: the organization has no coherent strategy for its data and the lab that produces it. To see that cause clearly, we need a model.
02. The Framework: The Digital Lab Maturity Model
We call our framework the Digital Lab Maturity Model, or DLMM. It is deliberately simple, four consistent layers, no more. A framework that changes shape cannot be used to benchmark an organization today and measure its progress later. The DLMM is the fixed reference; the maturity ladder in Section 3 is how we score an organization against it.
Most life science digital strategies operate on an implicit two-layer model: there is a digital, enterprise, IT-owned stack at the top, and there is a physical, lab-owned instrument estate at the bottom. The work of digital transformation, in this model, is to connect them.
This is the model that produces the symptoms in the previous section. Connecting two layers when the connection is itself two layers, orchestration and the data fabric, each with its own software, semantics, discipline, and ownership question, is what fails.
We propose a four-layer model instead.
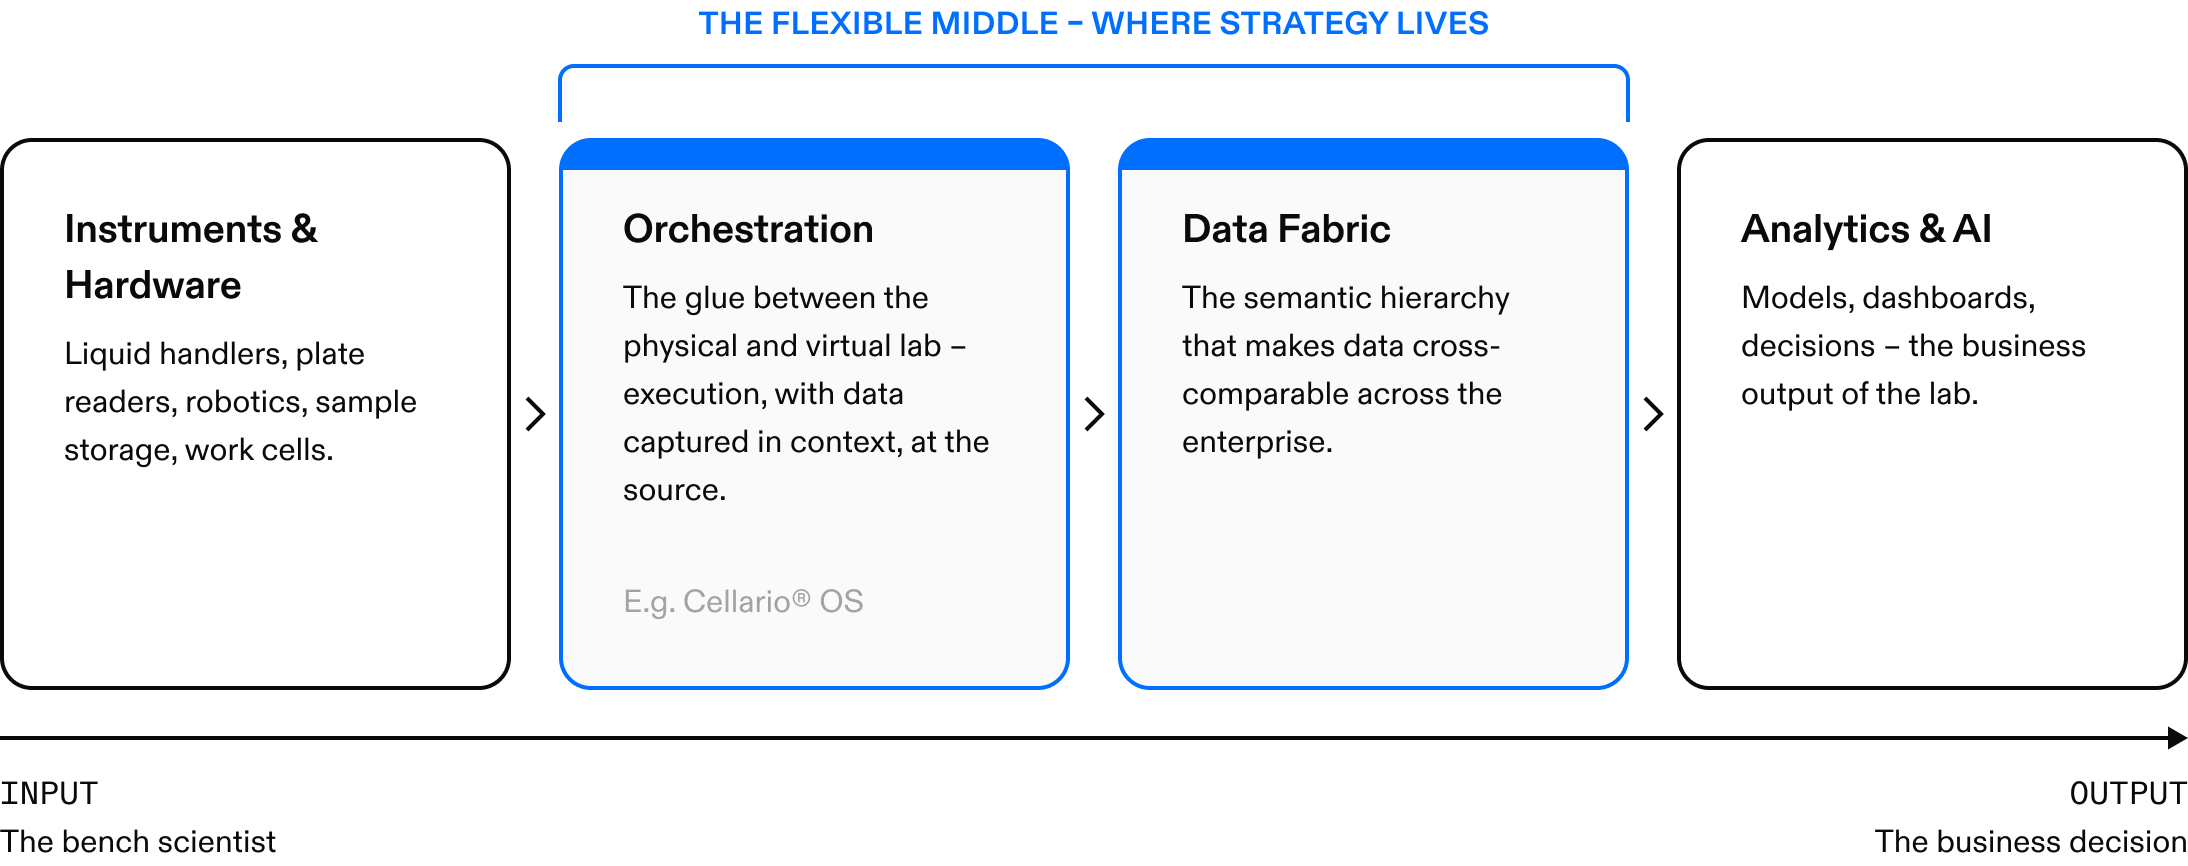
Figure 1. The Digital Lab Maturity Model: four layers from the bench to the business decision.
Why Now: AI Is Moving The Bottleneck
There is a reason this architecture matters more now than it did three years ago, and it is worth stating in the terms an executive is already thinking in: the Design, Make, Test, Analyze (DMTA) loop, also known as Lab in the Loop. AI and modern informatics tools are dramatically accelerating the Design and Analyze halves of that loop, compressing months of analysis into weeks and enabling far more virtual pre-work on design. As Design and Analyze speed up, the bottleneck moves to Make and Test, the physical half of the loop. To take advantage of faster informatics, an organization now needs to get design decisions to the bench and results back to the analysis tools as fast as possible, with as few hands touching the work as possible. That is precisely the demand that pulls orchestration and a connected lab from "nice to have" to "rate-limiting." The connected lab is what lets an organization convert faster analysis into faster iteration overall.
The Game Board: What Is Fixed, What You Can Move
A useful way to hold the model in mind is as a game board. On one side sits the enterprise infrastructure that is already largely fixed, the cloud provider, the informatics tools, the ERP and CRM systems the organization has standardized on. On the other side sits the physical world of the lab, which is semi-fixed, the instruments you own, the benchtop systems you need to fold in, even the work outsourced to CROs. Strategy lives in the flexible space between them, where orchestration and whatever additional IT infrastructure is required tie the two fixed worlds together. The job of a C-suite digital lab strategy is to understand which pieces are fixed, which can move, and how to connect them, and the advisory role of the two firms behind this paper is to provide the map.
A connected lab does not mean forced uniformity. Real organizations require nuance, a large company may run three different ELNs, grassroots "shadow" informatics efforts, and boutique AI tools chosen by individual scientific groups. The discipline is to standardize the strategy, not every tool: you enforce consistency at the level of architecture and data semantics, and you design that architecture to accommodate variation across sites and groups. Different sites will have different needs; the connective tissue that ties them to the enterprise should not.
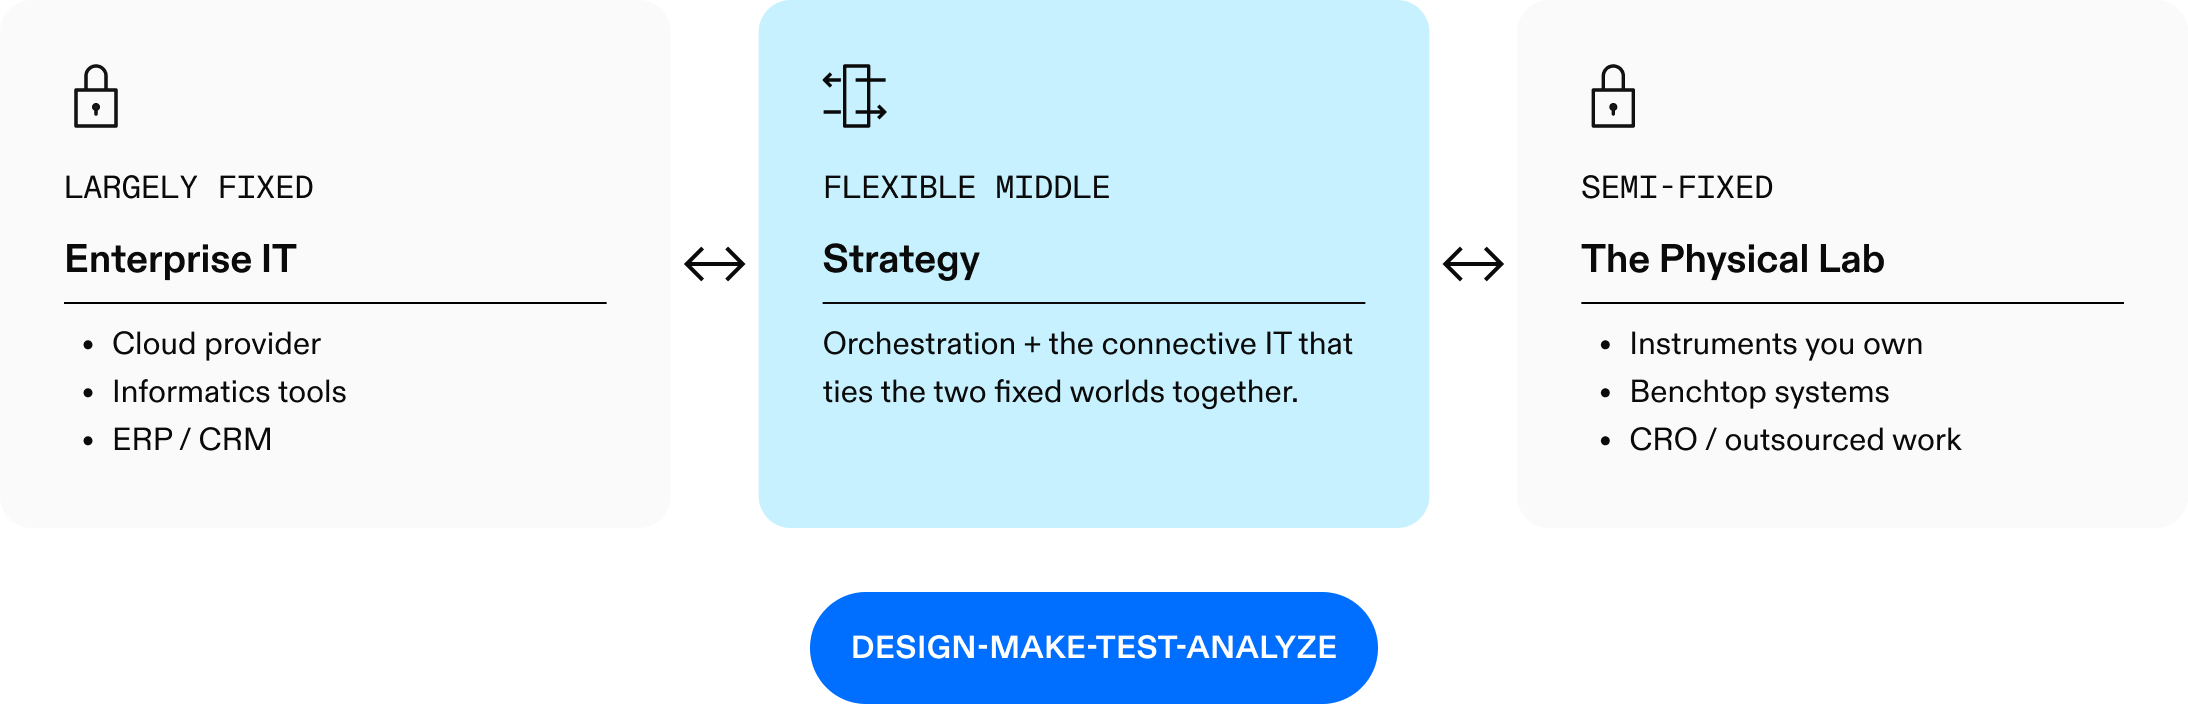
Figure 2. The game board: what is fixed, and what you can move.
What Each Layer Is For
The two outer layers are familiar. Instruments and hardware do the physical work of generating samples, signals, and assay results. Analytics and AI consume cleaned, contextualized data and turn it into models, dashboards, and decisions. The two inner layers are where the DLMM adds clarity.
The data fabric is where storage, governance, schema, lineage, and integration live. It is the home of the ELN, the LIMS, the data warehouse or lake, the master data management system, and the FAIR data initiatives that increasingly sit on top of all of these.
The orchestration layer is the operational software that turns scientific intent into executed work on physical instruments and turns the resulting raw output into structured, contextualized data with provenance. It includes workflow execution, dynamic scheduling, instrument integration, error handling, recovery, and the data contracts that determine how an instrument's output is captured, named, and handed to the data fabric. In a mature lab, it is its own layer with its own software and its own operational discipline. In an immature lab, it does not exist; it is labor distributed across scripts, shared drives, scientist habit, and hope.
The Problem Beneath The Problems: A Data Swamp, Not A Data Lake
Return to the first frustration in Section 1, "I cannot get a holistic picture from our data." It deserves special attention, because it is the problem beneath the other problems, and because there is hard-won precedent for solving it. A decade ago, industrial manufacturing went through its own first wave of connected-device investment. It largely failed, for a reason worth remembering: organizations rushed to build the infrastructure to collect data without first deciding what the data was. They ended up with enormous volumes of data that could not be compared across sites: the tag map from one machine did not match the next; timestamps were applied inconsistently. The result was widely described as a data swamp rather than a data lake.
What rescued industrial connectivity was not a bigger lake. It was the discipline of enforcing a semantic hierarchy, a common, organization-wide model of what each piece of data means, so that it is cross-comparable by construction. Life sciences is now at the same juncture. Each research group, each informatics team, has historically been its own island, and no one has had to make the data comparable at the enterprise level. Running science as an enterprise, and feeding production AI, requires exactly that.
We are deliberately pragmatic about how to get there. The industry has attempted broad data standards before, efforts such as Allotrope and Pistoia among them. While each has contributed to solving data problems, no effort has yet produced the universal standard the industry once hoped for. We do not ask a customer to wait for one. The pragmatic path, and the one we take in engagements, is to help an organization build a semantic hierarchy based on ubiquitous technology it can enforce inside its own walls. It does not need to be interoperable with a competitor to be transformational for you; it needs to be consistent for you.
And because our recommendations are grounded in a track record in real labs rather than in a standards committee, we can usually arrive with a best-practice starting model that a customer then adapts, a substantial head start over a blank page.
What Goes Wrong When Layers Are Conflated
Most of the symptoms in Section 1 are the predictable result of conflating two of these layers.
- Treating orchestration as part of the data fabric. When orchestration is assumed to be "what the LIMS does," the result is a LIMS overloaded with workflow logic it was not designed to carry, and a lab where instrument integration is a permanent project rather than a solved layer.
- Treating orchestration as part of the instrument layer. When orchestration is assumed to be "what the instrument vendors handle," the result is a set of orchestration islands, one per vendor, that do not compose into a coherent lab.
- Treating analytics and AI as adjacent to instruments. When AI initiatives reach directly into the instrument layer for data, they pick up raw output without context, without provenance, and without the operational metadata that would let a model know what it is looking at. This is a structural reason many AI pilots stall before scaling.
- Treating data fabric as a substitute for analytics tooling. When the data fabric itself is asked to produce decisions, it tends to grow features it was not designed for, and the analytics layer never matures into its own.
Why The Middle Layers Are The Leverage Point
Most organizations have already invested in the two outer layers, they own instruments, and they own enterprise digital tools. The value is unlocked or lost in the two middle layers. A strong data fabric without orchestration is fed unreliable data; a strong analytics and AI layer is starved of contextualized input; a strong instrument estate without orchestration is a collection of islands rather than a system. Conversely, a coherent middle, orchestration feeding a well-designed data fabric, makes every layer above it more effective and every layer below it more productive. This is where strategy, and investment, earns its return.
This is why the DLMM treats all four layers as one system. The layers are rarely missing as products, instruments, orchestration software, data platforms, and analytics all exist and can be bought. What is missing is an architecture that connects them, owned by someone with a seat senior enough to decide across all four. That architecture is what the maturity ladder at the center of this paper is designed to help you build.
Most organizations own the top and the bottom of the stack. The value is unlocked, or lost, in the middle.
03. The Maturity Benchmark: Where You Are And How To Climb
The DLMM becomes an operational tool when it is paired with a maturity ladder, a way to score where an organization sits today across all four layers, and to chart where it should go next. We introduce the four stages here in plain terms, as further discussion for each organization is specific to their individual business goals.
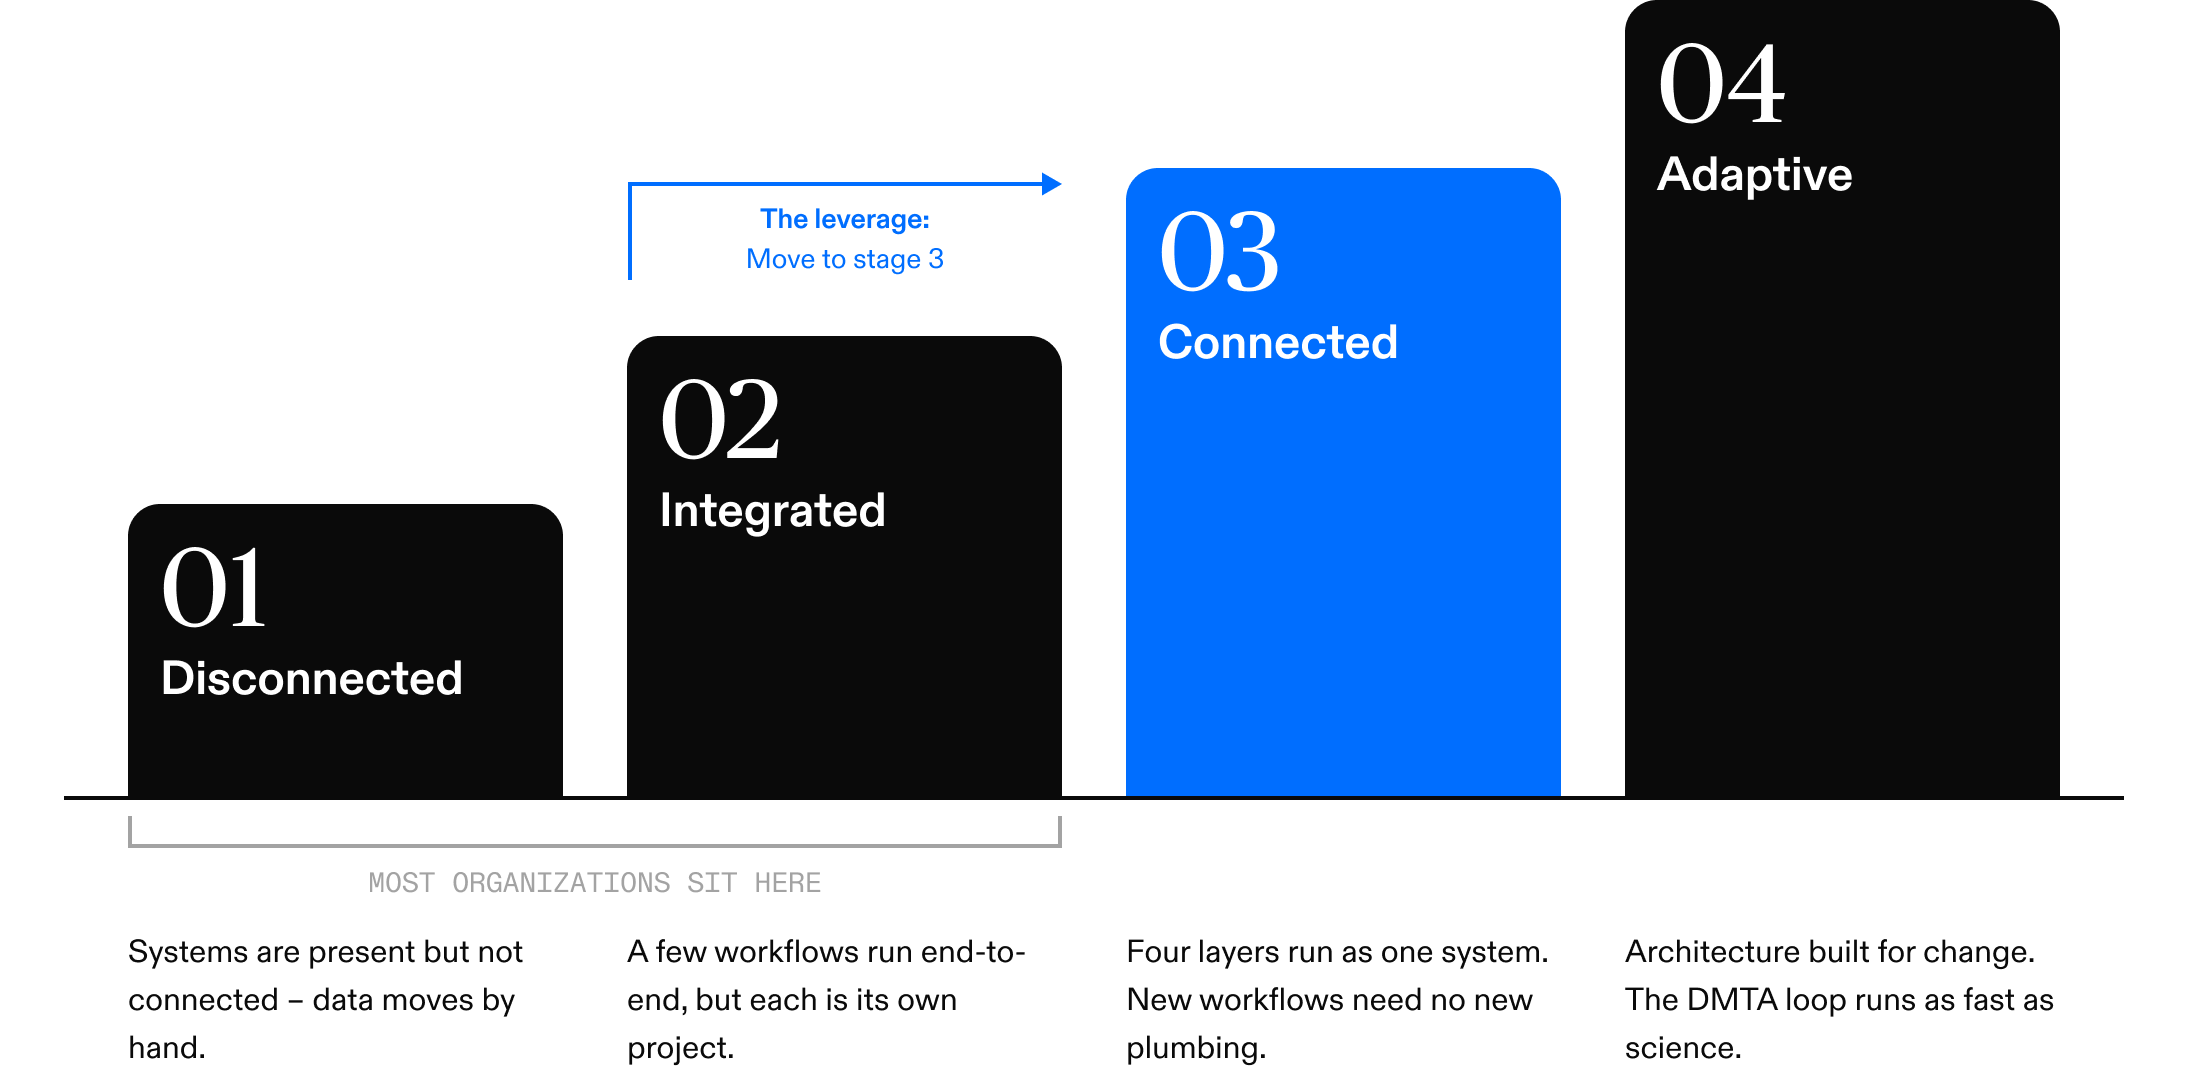
Figure 3. The four-stage maturity ladder: Disconnected, Integrated, Connected, Adaptive.
Stage 1. Disconnected
Instruments and digital systems are present but not coherently connected. Most data movement between them is manual or semi-manual. There is no orchestration layer in any meaningful sense; what little workflow coordination exists is distributed across scripts, scientist habit, and shared drives. Dashboards exist but are caveated. AI initiatives are pilots that depend on hand-curated datasets. Capital decisions are made one tool at a time.
How it feels: leadership is investing meaningfully in digital and in lab capability, but cannot point to a coherent answer when asked how the two connect. The frustrations from Section 1 are uniformly present.
Stage 2. Integrated
Specific high-value workflows have been integrated end-to-end. A handful of instruments speak to the LIMS reliably; one or two automated work cells produce clean data for the analytics layer; one AI use case has reached production. But each of these is its own project, with its own integration approach, and the patterns do not generalize. The connective middle exists in pockets but not as an organizational capability.
How it feels: leadership has proof that integration is possible and visibly valuable, but every new workflow requires a fresh project. The cost of incremental integration does not decrease over time.
Stage 3. Connected
The four layers are managed as one system, with clear ownership of the connective middle. New workflows can be added without inventing new integration patterns. Instrument-data contracts exist for the instruments that matter. The data fabric is fed reliably from the source, and the analytics and AI layer consumes from the data fabric rather than reaching directly into instruments. Capital decisions are evaluated against the architecture, not in isolation.
How it feels: leadership has a coherent architectural picture and can explain, in a single conversation, how science executed on the bench becomes a model in production. The organization can plan multi-year digital and lab investment as a single program.
Stage 4. Adaptive
The full four-layer architecture is in place and is itself designed for change. Workflows can be added, removed, or reconfigured without architectural disruption. New instruments are integrated against established contracts in days, not quarters. AI capabilities are deployed as a standard part of the workflow design process, not as exceptional initiatives. The Design, Make, Test, Analyze loop turns as fast as the science allows. The organization treats its lab and digital estate as a competitive asset that it actively manages.
How it feels: leadership is no longer debating whether digital transformation has succeeded. The conversation has shifted to which scientific problems to point the system at next.
Most large life science organizations sit between Stage 1 and Stage 2. The leverage is in the move to Stage 3.
In our combined experience, most large life science organizations sit somewhere between Stage 1 and Stage 2. A smaller number sit at Stage 3, almost always as a result of deliberate architectural work over multiple years. Stage 4 is rare and is generally seen in tech-bio organizations that designed for it from the beginning. The most common, and most consequential, leverage is in the move from Stage 2 to Stage 3, that is, in the explicit investment in the connective middle layers.
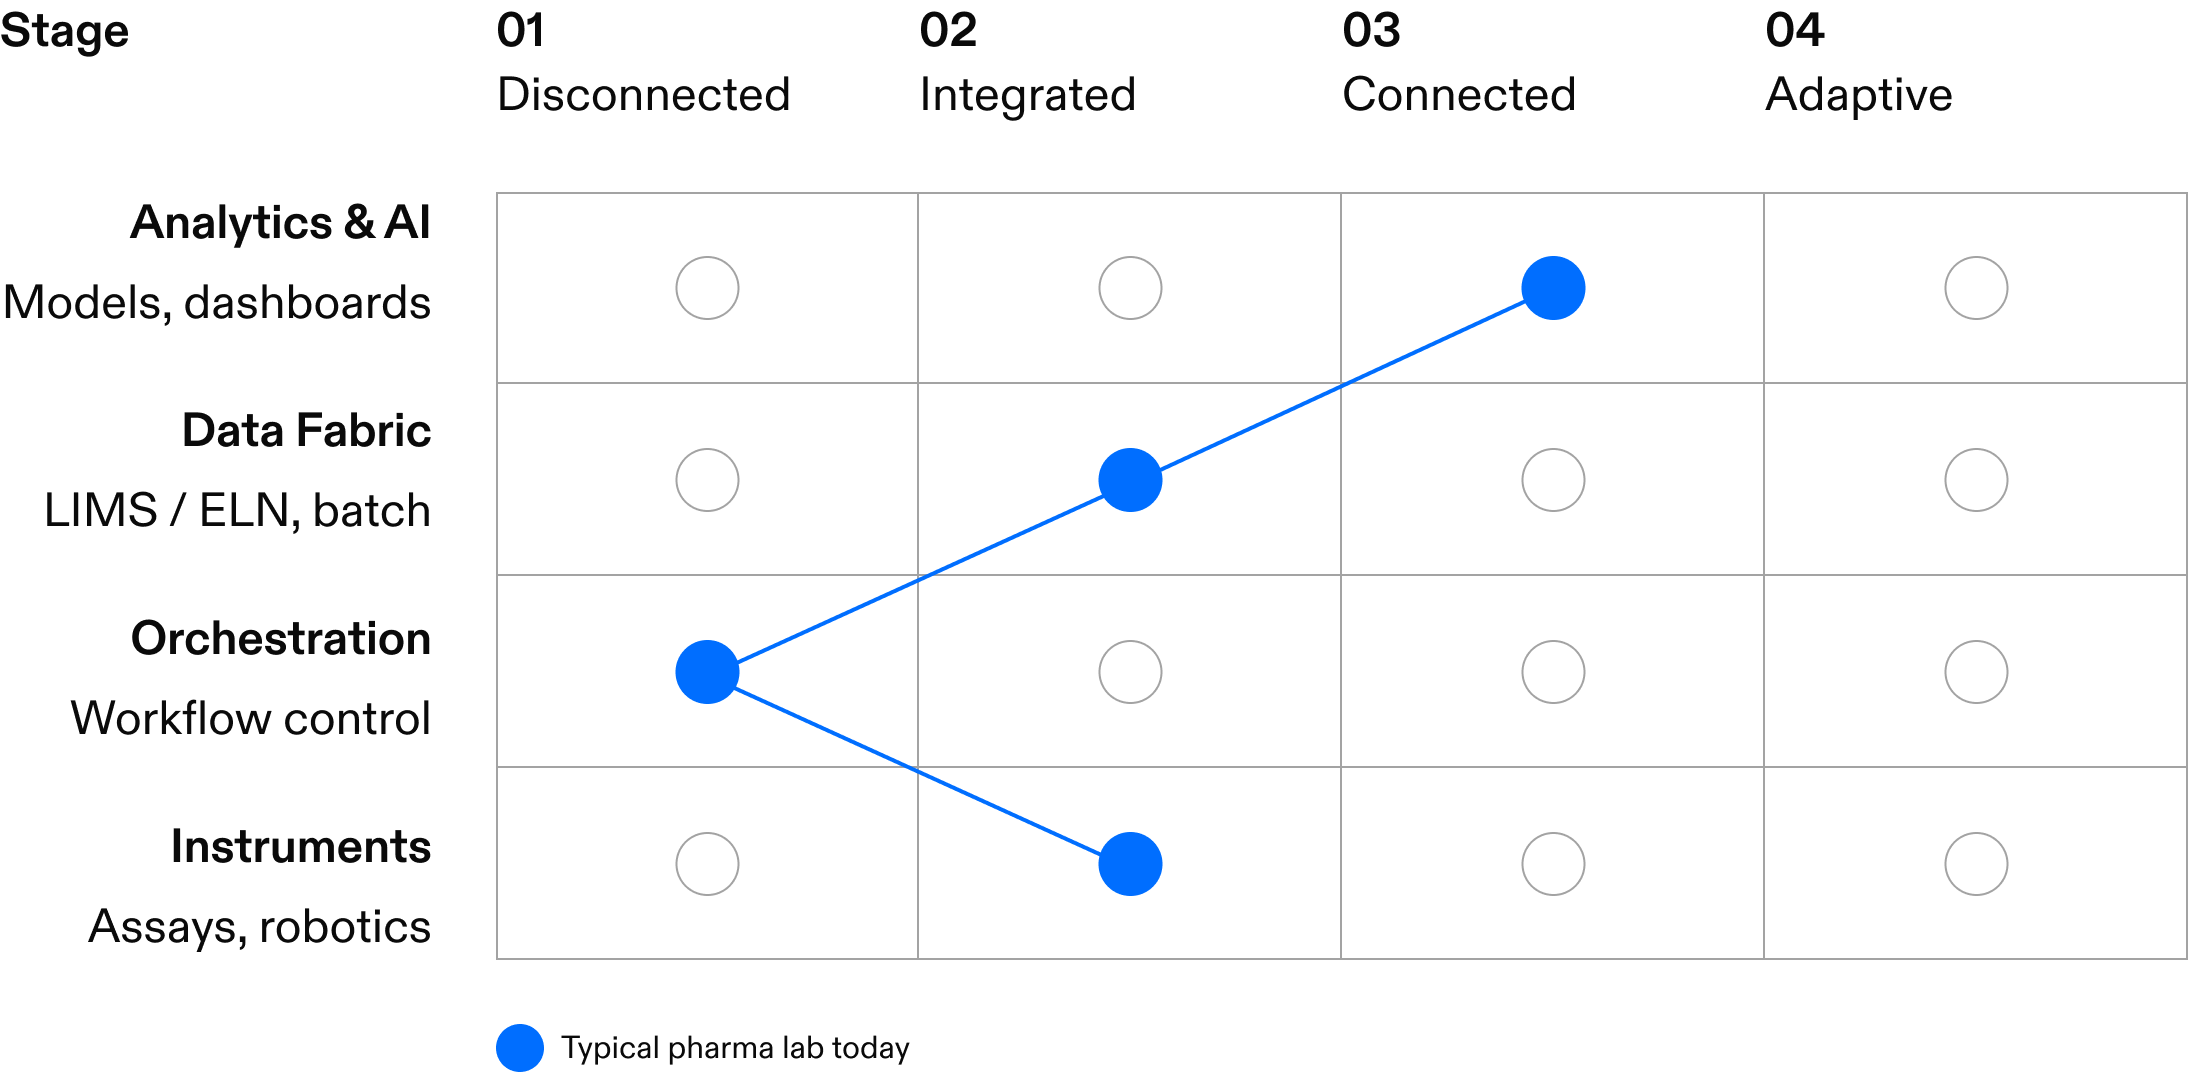
Figure 4. Example scoring across the four layers for a typical pharma lab today.
Five Questions To Locate Yourself On The Ladder
These five questions are derived directly from the DLMM, and they are designed to surface the architectural seams that tool-by-tool decisions tend to obscure. Taken together, they place you on the ladder above.
01. Can we get our data in one place, and would it survive M&A?
Can leadership get a unified, trustworthy view of the organization's scientific data across every site and team, and if you acquired a company tomorrow, could you fold its data in without a ground-up redesign? If not, the organization lacks the enforceable semantic hierarchy described in Section 2, and the fragmentation frustration is structural rather than incidental.
02. Where does our connective middle live, and who owns it?
Where does the work of turning scientific intent into executed work, and raw output into contextualized data, actually live today, and who owns it end-to-end? In most organizations no single role does. Lab operations owns the instruments; digital owns the data fabric and analytics; the connective middle sits between them and, without explicit ownership, defaults to whichever group complains loudest. Naming an owner for the middle is the precondition for treating it as a strategic asset.
03. Are our AI initiatives honest about their dependencies?
For each significant AI/ML initiative under leadership attention, ask: what does it assume about the orchestration and data fabric layers, and are those assumptions actually true in our current estate? This question alone reorders many AI roadmaps, because it surfaces which initiatives are gated by upstream architectural work and which are genuinely ready to scale.
04. Can we see what the lab costs to run, and our turnaround time?
Can you state, with evidence rather than estimate, what a given workflow costs to run and what its turnaround time is, and can you show how both changed after your last automation or digital investment? If those numbers are hard to produce, the disconnect between the lab and the digital stack is costing you the ability to make and defend the investment case.
05. Are our capital decisions evaluated against the architecture?
When a new instrument, platform, or piece of digital tooling is being evaluated, is the evaluation conducted in isolation, or against the DLMM? Asking this consistently is the single most reliable way to prevent the accumulation of tool-by-tool decisions into an estate no one designed.
Next Steps: Where Joint Expertise Accelerates The Path
Our two organizations work together, partnering clients with our advisors who can speak credibly across the full stack: from data and AI architecture at the top, to orchestration and instrument operation at the bottom, in a single conversation. In a cohesive engagement, we dive into each of the four layers in turn, beginning with the framework above.
If this paper has been useful, the most natural next step is a working session with your leadership team to score your organization against the DLMM, providing a diagnostic of where you sit along the Connected Lab Maturity Benchmark. We develop a shared vocabulary, a current-state benchmark on the ladder, and a recommended set of high-leverage next moves. From there, the four layers become the work we do together.
About This Paper
This is the first paper in a joint series built around the Digital Lab Maturity Model. Planned follow-ups include a deep dive on orchestration as the boundary layer between the lab and enterprise IT ("The Missing Layer"), and a paper on building an enforceable data semantic hierarchy for life science organizations.
HighRes
HighRes is a global laboratory automation company that designs and builds modular automation systems, dynamic scheduling and orchestration software, and integrated lab automation instruments for pharmaceutical, biotech, and academic research customers. Cellario OS is the company's orchestration platform, unifying instruments, workflows, and data across the lab. HighRes was founded in 2004, is headquartered in Beverly, Massachusetts, with European headquarters in Manchester, United Kingdom, and operates as part of the Axel Johnson group.
highres.com · 102 Cherry Hill Drive, Beverly, MA 01915, USA
Involve Data
Involve Data is a data strategy services firm, partnering with pharmaceutical, VC, biotech, and tech bio organizations on digital transformation, data architecture, lab automation strategy, and AI/ML enablement, translating scientific intent into outcomes. Recent work includes greenfield NGS lab design, integrated digital ecosystems for tech-bio companies, and ongoing IT and data leadership for life science venture portfolios.
involvedata.com · solutions@involvedata.com
To Continue The Conversation
To request a working session, ask follow-up questions, or discuss any of the ideas in this paper, contact either organization through the channels above. Joint engagements, in which both teams are present in the same room with the customer's leadership, are available on request, and are the format we believe delivers the most value when the underlying question spans the full stack from strategy to execution.
© 2026 HighRes Biosolutions and Involve Data. All rights reserved. Cellario, Nucleus, MicroDock, FlexCart, and HighRes are trademarks or registered trademarks of HighRes Biosolutions.


